Rising Rates
Introduction: The purpose of this lab is to determine how metabolic rates are affected after activity. Materials used in this lab were a camera for documentation, my self for the physical activities, and a stop watch to time the duration of each activity as well as take pulse and respirations.
First metabolic rate to be measured is the pulse. I will use the cartoid method, count for fifteen seconds then multiply by four. The average resting heart rate varies but generally is accepted to be between 60 to 80 beats per minute.
Next, respirations will be measured. This I will count a breath in and out as one for thirty seconds, then multiply by two. The average respiration for an adult is about twelve per minute.
Lastly, blood pressure will be taken. If I had the correct tools, I would take it by hand, using the pump and listening with a stethoscope until I could no longer hear the blood rushing. At that point, I would release the pump slowly until I heard a slight pop, which would be the systolic number. Once the last sound was heard, I would record the diastolic number. Instead, I went to Wal-Mart and let the machine do it for me. The average adult numbers are 120/80.
The three activities I have chosen to perform will be: 1. Jumping Jacks, 2. Singing, 3. Kissing.
Hypothesis: I hypothesize that my first and third activity will increase in every metabolic rate. My second activity will increase my respiration rates, but everything else will be close to the resting rate.
| | Pulse | Respiration Rate | BP Systolic | BP Diastolic |
| Activity One: Jumping Jacks | Increase | Increase | Increase | Increase |
| Activity Two: Singing | Same | Increase | Same | Same |
| Activity Three: Kissing | Increase | Increase | Increase | Increase |
Materials and Methods: The following is a pictorial description of materials and methods I used.
First, I took all of my resting measurements except blood pressure. To do this, I laid on the floor and rested for about five minutes. Then, I watched my clock on my computer because it had a second hand. I took my pulse for fifteen seconds then multiplied by four. While I was taking my pulse, I had my assistant, Michael, count my respirations for thirty seconds, with me watching the time. We multiplied that number by two to get beats and breaths per minute. We then proceeded to do each activity for thirty seconds. Immediately after the activity, I took pulse and Michael took respirations. Then we went to Wal-Mart.

At Wal-Mart, I began by taking my resting blood pressure. A bruise was visible by the third round (I easily bruise). Then I did each activity three times, every time followed by a measure.

I chose jumping jacks for my first activity because I wanted something that I knew was really going to get my heart going and the blood circulating. I knew, positively, that my rate was going to increase as well as blood pressure because my blood needed to be moving faster. After the three repetitions were over and measurements taken, my assistant and I took a five minute break to get everything back to normal.

Next, I serenaded my assistant three times and took measurements. I sang the same song, a Gerber Baby commercial song I have known since I was a child, three times, taking my blood pressure after each song. Again, I took a five minute rest and came back for the last part.

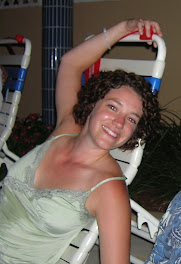
This picture is posted with permission from my assistant. He partook in the last activity, kissing. This one would be appropriately described as laughing, but for the sake of the experiment, we will go with what the activity called for. I chose kissing because I had previously taking a test that measured body temperature after certain activities and kissing was one of them. I wanted to learn how else it effects the body as well.

Data: Below is a table I used to record all of my data. The left hand row represents which metabolic rate I was measuring and the top columns depict which repetition I was doing and then the average of those reps.
| | Rep 1 | Rep 2 | Rep 3 | Rep 4 | Rep 5 | Mean |
| Baseline | | | | | | |
| Pulse | 68 | 72 | 68 | 64 | 72 | 69 |
| Respiration | 16 | 12 | 14 | 14 | 16 | 14 |
| Systolic | 125 | 120 | 118 | 121 | 120 | 119 |
| Diastolic | 73 | 65 | 68 | 67 | 71 | 65 |
| Activity One: Jumping Jacks | | | | | | |
| Pulse | 94 | 126 | 132 | | | 117 |
| Respiration | 18 | 18 | 22 | | | 19 |
| Systolic | 144 | 149 | 150 | | | 148 |
| Diastolic | 74 | 76 | 75 | | | 75 |
| Activity Two: Singing | | | | | | |
| Pulse | 78 | 82 | 76 | | | 79 |
| Respiration | 16 | 18 | 20 | | | 18 |
| Systolic | 134 | 132 | 138 | | | 135 |
| Diastolic | 72 | 70 | 74 | | | 72 |
| Activity Three: Kissing | | | | | | |
| Pulse | 100 | 90 | 72 | | | 87 |
| Respiration | 20 | 22 | 18 | | | 20 |
| Systolic | 123 | 120 | 123 | | | 122 |
| Diastolic | 71 | 62 | 68 | | | 67 |


The graph above represents jumping jacks only. Please refer to the singing graph below this for what each color of bar means.


The above graph is strictly the measurements of kissing. These bars represent each repetition
with the mean as well. I chose to include all of the graphs separately so one could see how my rates changed with each measurement. Below, is the final graph, with all averages put together to show that each activity increased my rates.
This last graph is representative of all of the means for each group, as listed on the right side of the graph. This graph shows that every metabolic rate increased in comparison to the resting rate. The closest to resting rate was often kissing, but singing respirations were close to the resting rate as well.
Analysis of Data: After carefully observing the data, my hypothesis was not entirely correct. After performing all activities, each metabolic rate increased. Often, it increased in considerable amounts. For example, comparing base rate pulse to the jumping jacks pulse, my rate jumped up about forty-eight beats per minute. My respiration rates increased from the resting rate, but from each respiration rate involving the activity, it remained fairly steady.
Problems with Data or Technique: Here are some problems that occurred. The blood pressure machine at Wal-Mart, as I was told by the pharmacist, varies its readings depending on how many times it is used. A doctor from
Conclusion: In general, the effects of different types of activities on metabolic rates generally increase the rates. This is because as the body is pushed to work harder, it expends more energy. One has to breathe harder and faster to get the proper amount of oxygen in, in order for the cells to perform their functions. The oxygen will go to the blood cells, which, in turn, diffuse the oxygen to other cells that need it through exchanges in the capillaries.
Conclusion: Overall, this experiment was joyful and made me laugh often. It also allowed me to exercise my knowledge of the body’s need for oxygen and how it was circulating throughout my body during each activity.
1 comment:
Katie Howser
SELF/UNIT EVALUATION. I didn’t see this for Unit Two.. These are really helpful for me to know how the unit went and to get any feedback on the course.
COMPENDIUM ONE—CARDIOVASCULAR/IMMUNE. This compendium is extremely compete and well-done. Talbe of contents, great images, nice compete coverage of all topics and good sources and references.
COMPENDIUM TWO—NUTRITION
I saw a nice complete entry on digestion and then just an outline for nutrition—did I miss the actual compendium entry for the toppics on nutrition?
LAB ONE—BLOOD PRESSURE
Nice job on this lab. Good data graphs and good analysis.
LAB TWO—FOOD FOR A DAY
Interesting results…I’m surprised you couldlnt’ get just a plain apple on the nutrition calculator…it usually has most of those raw foods as well,,,but it’s been a while since I played with it. Glad this class is overlapping with nutrition a little bit.
LAB PROJECT—EXERCISE PHYSIOLOGY
Well, I noticed a theme here was interruption of this important experience by laughing…obviously not good scientific technique—this is a serious business! So, seriously, an award for an original activity—kissing…you just never tell us how long, but at least you had a willing assistant! I just wonder what the Walmart customers thought…Your results are very well presented. I’m not surprised that singing would also increase metabolic rate, if nothing else perhaps due to the “fight-or-flight” sympathetic response (more on this in A and P) that singing in public is likely to cause. Great graphs—nice and very thorough analysis and I definitely appreciated the enthusiastic approach to the lab!
ESSAY—EATING
Thanks for the very thoughtful essay. Yes, I know that cultural based diets are not always the best, although….if that steak is from a local grass-fed cow and the potatoes are not cash-cropped, it’s probably not too bad…I also liked the frowny face and in general appreciate your perspective.
Katie, excellent job on this unit. I really appreciated your lab project and your essay. I didn’t see part of the nutrition compendium notebook and also the self/unit eval. Everything else was basically perfect—keep up the good work!
LF
Post a Comment